May 19, 2016
July 25, 2013
Are you overpaying your BI engineers?
We had a team exercise to design a simplest-possible-but-still-useful BI dashboard / report / KPI.
January 6, 2013
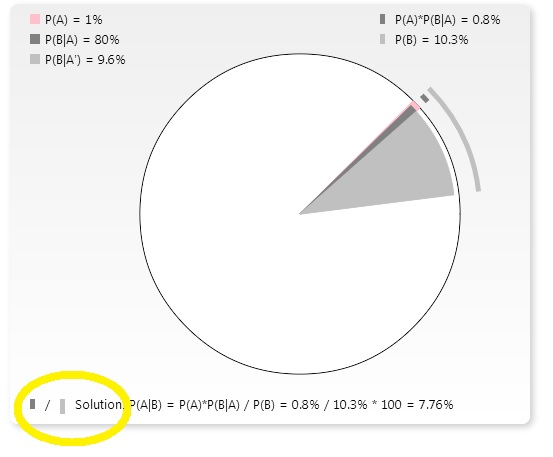
A graphic solver for Bayesian problems using Venn Pie Charts
Here is a link to another HTML5 demo – a Venn Pie Chart showing solutions for simple Bayesian problems.
The point I am trying to make is that solution is the ratio between the areas of the silver and gray sectors, or, rather, lengths of corresponding arcs.
Screenshot:
January 2, 2018
Mnemonics for 5 Pillars of AWS Well-Architected Framework
SyRuP CoOp:
- Security
- Reliability
- Performance Efficiency
- Cost Efficiency
- Operational Excellence
March 10, 2017
February 17, 2017
A patent generator. Serious fun.
From: http://lav.io/2014/05/transform-any-text-into-a-patent-application/
An apparatus and system for picking up the cards
ABSTRACT
An apparatus and system for picking up the cards. The devices comprises an only room, a wooden wall, a top floor, an early plane, a tall hotel, a urine-yellowed road, a little pocket, an open window, a pleasant camp, a horse-hair-plumed helmet, a white road, an icy road, an other cot, a little plane
BRIEF DESCRIPTION OF THE DRAWINGS
December 24, 2016
Redshift “Failed temporary block read” / code: 1075
Problem
A Redshift query fails with a “Failed temporary block read / code: 1075” error.
We check for failed disks and see none:
select host as node_id, count(*) as failed_disk_qty
from stv_partitions
where part_begin=0 and failed = 1
group by host;— returns nothing
Only after the failure repeats X times (10?) the disk is marked as failed and the aforementioned query returns a row with the count of failed disks.
As as soon as the disk is marked as failed: Redshift starts avoiding the bad block, the Redshift support team generously replaces the whole failed node in no time.
Essentially, because of a single failed block we get a whole brand new computer
Great!
Why is this a problem?
The failing query takes XX-YY minutes to complete.
If we have to repeat the cycle 10 times – it will take XX*10-YY*10 minutes for the cluster to recognize and blacklist the failing disk.
Since only some queries fail – we suspect those with a WITH clause, which creates temporary tables behind the scenes – the process could take even longer.
Workaround
The workaround we came up with is to run the same query in parallel to make it fail faster and mark the disk as bad sooner.
April 7, 2016
One table is worth 3000+ words
This is how a data engineer interprets a useful, but long and dry article in Harvard Business Review.
If rules of BI reporting applied to tech writing, then, similarly to dashboards providing at-a-glance views, data samples would help to retain readers and prevent TL;DRs.
Placing a summary table at the beginning of the article – is the McKinsey’s Pyramid Principle for data geeks.
The article (3k words): “Making Yourself Indispensable” by Zenger, Folkman, Edinger
The table: skills_main_complementary
December 27, 2015
An AWS Sonnet: Build a custom VPC with NAT
… in 14 steps. Hence the sonnet reference.
This is a condensed narrative for lectures 48 and 49 from the AWS Architecture class on Udemy. The narrative is much faster in getting to the point than 30 minutes of linear videos, it is precise and can be read in any direction.
1. Create a VPC, 10.0.0.0/16.
2. Create in the VPC 2 subnets, in availability zones “a” and “b”, 10.0.1.0/24 and 10.0.2.0/24 respectively.
3. Create an internet gateway and attach it to the new VPC. To reduce clutter – set “Filter by VPC” in the left upper corner of the VPC dashboard to the new VPC.
4. Create in the new VPC a routing table, add a route “0.0.0.0/0 – internet gateway” to it.
5. Associate the subnet “a” with the new routing table. This will make the subnet “a” public.
6. Create a security group, open inbound SSH, HTTP, HTTPS for Anywhere.
7. Launch an instance “a” in subnet “a”, with an Auto-Assigned Public IP, selecting the new security group.
8. Launch an instance “b” in subnet “b”, WITHOUT an Auto-Assigned Public IP, in the same security group.
9. SSH to the instance “a”, verify that it has access to internet, e.g. “sudo yum install telnet” should work.
10. From the instance “a” SSH to the instance “b”. It should not have access to internet, e.g. “sudo yum install telnet” should time out.
11. Launch a NAT from a community image, select subnet “a”, Public IP, and the same security group (just for the demo – there is no a separate security group, in prod create a separate group for traffic between subnet “b” 1.0.2.0/24-nat).
12. Turn off the source-destination check for the NAT instance (Networking-Change Source / Destination Check).
13. Add to the main routing table (not the new one from step 4!), a route “0.0.0.0/0 – the new NAT instance”.
14. Repeat the “sudo yum install telnet” test from instance “b” – it should work now, although the instance “b” is still in a private subnet.
October 26, 2015
Sherlock Holmes was a Data Engineer or How SQL changes the way one thinks
Here is an idea – SQL solutions usually rely on deduction, programming – on induction.
Based on anecdotal evidence, there are differences between approaches used by data oriented and code oriented practitioners. Supposedly, tools we use affect our reasoning process. Naturally, “When one has a hammer…”
It looks like writing SQL and solving problems with existing data exercises deductive reasoning. Designing new software and coding it – uses inductive reasoning.
This is why – when solving data problems – SDEs jump to binary trees, but DEs create relational tables first.
Of course, this dichotomy comes with the usual disclaimer:
“All generalizations are dangerous, even this one.”
August 21, 2015
Dynamo DB Local : a missing tutorial for Python
Dynamo DB Local is an excellent learning and testing tool.
It has a JavaScript shell with a useful but verbose tutorial:
DynamoDBLocal: Downloading And Running
DynamoDBLocal: Javascript Shell
Here is the same tutorial, translated to Python 2.7.
(more…)
August 18, 2015
Diagrams: Oversize to emphasize
Few of my fellow nerds are visual-spatial thinkers. Some of them (ladies, mostly) have good taste and
produce not only neat charts, but clean and good looking code.
Just a little bit of color theory goes a long way for UI design and visual analytics.
The majority of my fellow nerds are logical thinkers, with no interest in fine arts and subtle matters of style and harmony.
This is unfortunate, because just a little bit of visual taste would have made they diagrams much more readable and communication more efficient.
A recent diagramming marathon brought us three rules of thumb:
1. Oversize to emphasize.
2. Oversize to show composition.
3. Cater to western readers: logic flows left-right, top-down.
Here is an example – a standard no-frills vertical tree.

What is the most important block here? Where do I begin?
“Oversize to emphasize” helps to bring some order.

Although it is possible to show composition using arrows, this approach
requires an extra step – it forces users to trace arrows.
Luckily, our brains are really good in filling gaps.
We could help readers’ brains by using the “Oversize to show composition” trick.

A useful side effect – we get rid of diagonal arrows which break linear visual flows.
Having clear visual flows helps readers.
And the most familiar flow for all of us is the text flow – from left to right, from top – down.

So, placing inputs in the left top quarter and outputs in the bottom right quarter will make the diagram naturally readable.
There is one problem. I don’t know if logical readers would care.
Are the tricks working only for visual-spatial ones?

You must be logged in to post a comment.